sam-b.github.io
Intro to Windows kernel exploitation part 0: Kernel Debugging
This is the first post in a fairly long series covering exploiting Windows kernel vulnerabilities, starting at setting up kernel debugging and continuing on through exploiting toy drivers and a real vulnerability on Windows 7 to exploiting the Windows 8.1 kernel and wherever else this series ends up.
This post is going to run through setting up and using a kernel debugger, in part 1 we’ll start looking at doing some actual exploitation.
Getting Setup
In order to use WinDbg for kernel debugging we will be running it outside of the host machine, in some circumstances you can run it on your host machine but its far easier to just use VMs (especially when you’ll be blue screening the machine ;)). To do this we create two Virtual Machines and use one debug the other over a virtual serial port. For this series of posts I’m using a Win10 VM for debugging and an unpatched 32 bit Win7 VM as the target machine (because well, simpler times and all that) running inside of VirtualBox.
Start off by setting up the VMs as normal and then install Windows Debugging tools in your debugging VM which you can get from the Windows SDK, you won’t need debugging tools in the target VM. Once setup, you can enter the command ‘bcdedit /debug on’ in an administrator command prompt on the target VM, this makes it so that on start-up it will connect to its com1 serial port and allow another machine to connect to it and debug it.
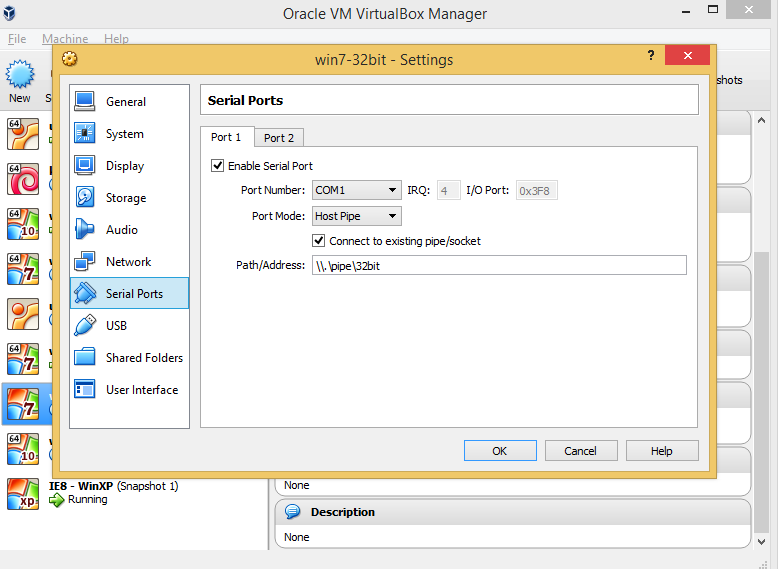
Now we need to create a serial device for both of our VMs, power both of them off and then open their VM settings screens and change the contents of each machines serial port tab to look like the following:
Target Machine – win7 32 bit
 Debugger Machine – win10
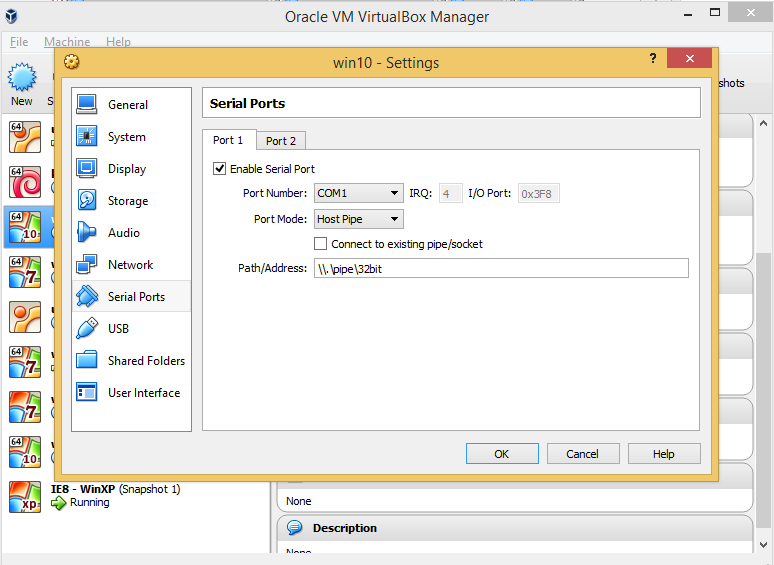
Now both machines should connect to a host pipe on COM1 at path \.\pipe$name on startup. The name can be anything, as long as it matches on both VMs. The only configuration difference is that your debugging machine is creating the pipe on startup and the target machine is connecting to the pipe that the debugging machine should have already created.
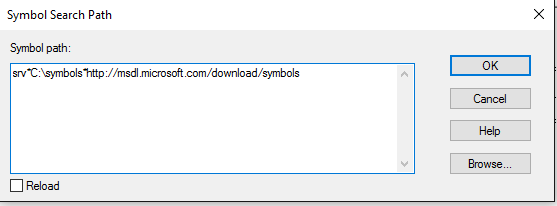
Now power on your debugging machine and start WinDbg, first we need to set our symbol path. Setting the symbol path means that Windows can download PDB (Programme Database) files containing the debug data which allows us to see object/function/etc names instead of just memory addresses, these are created by the linker at build time and aren’t include in the final binaries as the symbols are only needed for debugging and excluding them allows for smaller and faster binaries. This can done in WinDBG by going to the File menu and then selecting Symbol File Path and entering ‘SRV*$symbol_cache_path*http://msdl.microsoft.com/download/symbols’ in my case I use C:\symbols as my local symbol cache directory for example:
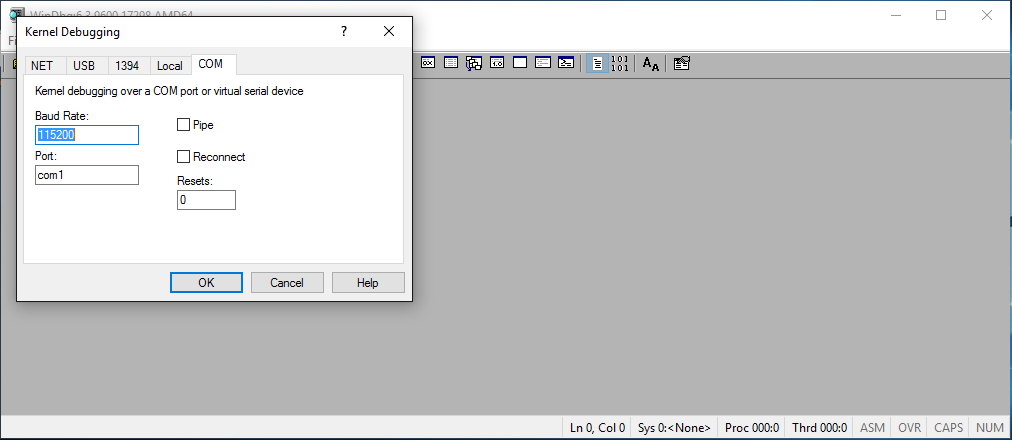
When needed WinDbg will download the symbol file for each loaded module (executable, library etc), caching them in the C:\symbols directory. At this point simply click OK and then to start kernel debugging go to File-> Kernel Debug… -> COM and click OK as shown below:
Now power on your target machine and once it has started you should see its details in the WinDbg output like so:
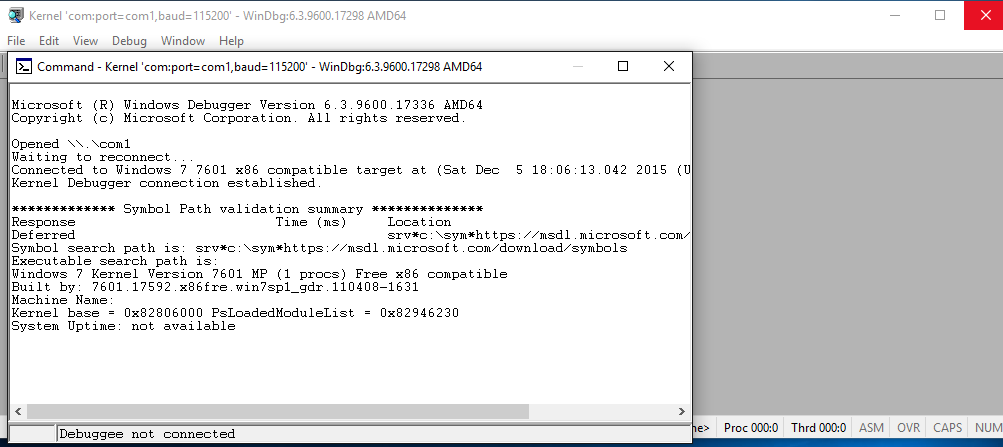
With all this done, we are ready to start using our debugger.
A quick WinDbg tutorial
Start by going to the ‘Debug’ menu and selecting ‘Break’, this should pause the target host as can be seen by trying to use that VM (everything should be frozen). Now we can make sure that our symbols are loaded correctly by entering ‘dt nt!_TEB’ in the command box and hitting enter, the ‘dt’ command stands for ‘display type’ and can be used to see local variables, fields of structures or data type definitions. The command should give output that looks like this:
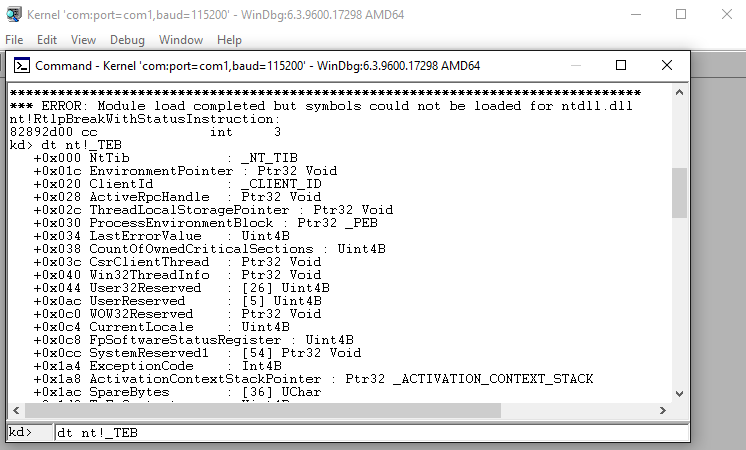
You’ll notice that this doesn’t show the structure of substructures, for example the _NT_TIB structure. We can see substructures aswell by rerunning the command with the ‘-r’ flag to recursively print definitions and ‘-r $int’ to recurse a chosen number of levels.
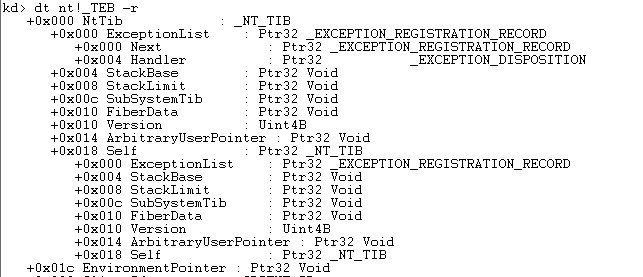
The TEB structure is the Thread Environment Block and it describes the state of a thread, there’s a cool visualisation of how it has changed over the years at: http://terminus.rewolf.pl/terminus/structures/ntdll/_TEB_combined.html, however it’s just a random structure I chose so we don’t need to know any more about it for now :)
Next run the command ‘ba e 1 nt!ZwCreateFile’, this sets a hardware breakpoint which will be triggered on the execution of the first byte of data at the address that ZwCreateFile is located in memory. I’m using hardware breakpoints because software breakpoints are unreliable while debugging kernel mode code and they also expose some extra functionality, for example we can set the type of access to be read, write or execute while software breakpoints can only be triggered on execute and we can set the granularity to be 1 to 4 bytes. On the downside on x86 we can only have four hardware breakpoints set at a time as they use the dr0-dr3 registers (where dr stands for debug register), if you have the register view open in WinDBG you should be able to see the address of nt!ZwCreateFile in the dr0 register now.
The ZwCreateFile function is part of the Zw prefixed family of functions inside of ntdll.dll and ntoskrnl.exe which are light weight wrappers around system calls. The Zw doesn’t actually stand for anything but Nt and Zw calls are differentiated by the fact that Zw functions behave slightly differently when called from kernel mode code. ZwCreateFile itself is a routine which creates a new file or opens an existing one.
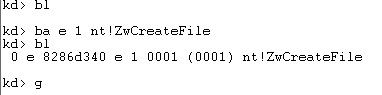
You can see I also used ‘bl’ to list the current breakpoints, the first value - 0 is the breakpoint ID which we can use to refer to the breakpoint in other commands. The second field is the breakpoint flag and is currently ‘e’ which indicates that it is enabled, the common values you will see here are ‘d’ if the breakpoint is disabled and ‘u’ which stands for unresolved and appears when a breakpoint is set on an address which doesn’t match a symbol in any of the currently loaded modules. The next value (8286d340) is the memory address the breakpoint has been placed at, this should match the value in the corresponding drX register. The next ‘e’ indicates it is triggered on execution and the 1 is the byte granularity. The next two values represent the counter of the number of times the breakpoint must be hit again before it is triggered and in brackets the initial counter value.
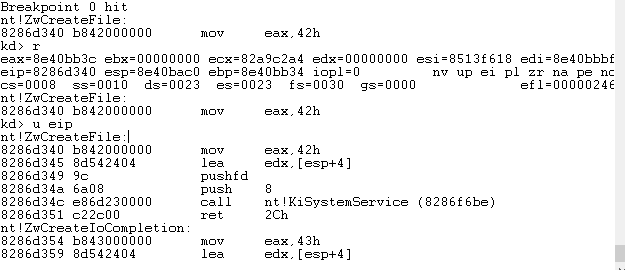
Now we type ‘g’ (which is short for go and resumes the targets execution) in the command window, hit enter and go back into the target VM. We then open notepad, select file then Save As and everything should freeze. Going back to our debugging VM we see that the breakpoint has been hit. We can enter the ‘r’ command to see the current register state and ‘u eip’ to view the instructions which triggered it.
 We can enter ‘bc 0’ to clear the breakpoint or ‘bc *’ to clear all set breakpoints if you’ve entered extra breakpoints and then enter ‘go’ again.
Now that you’ve got kernel debugging working, go check out part 1: Getting Started With The HackSysTeam Extremely Vulnerable Driver.